Living Canvas - Visual Code Analysis
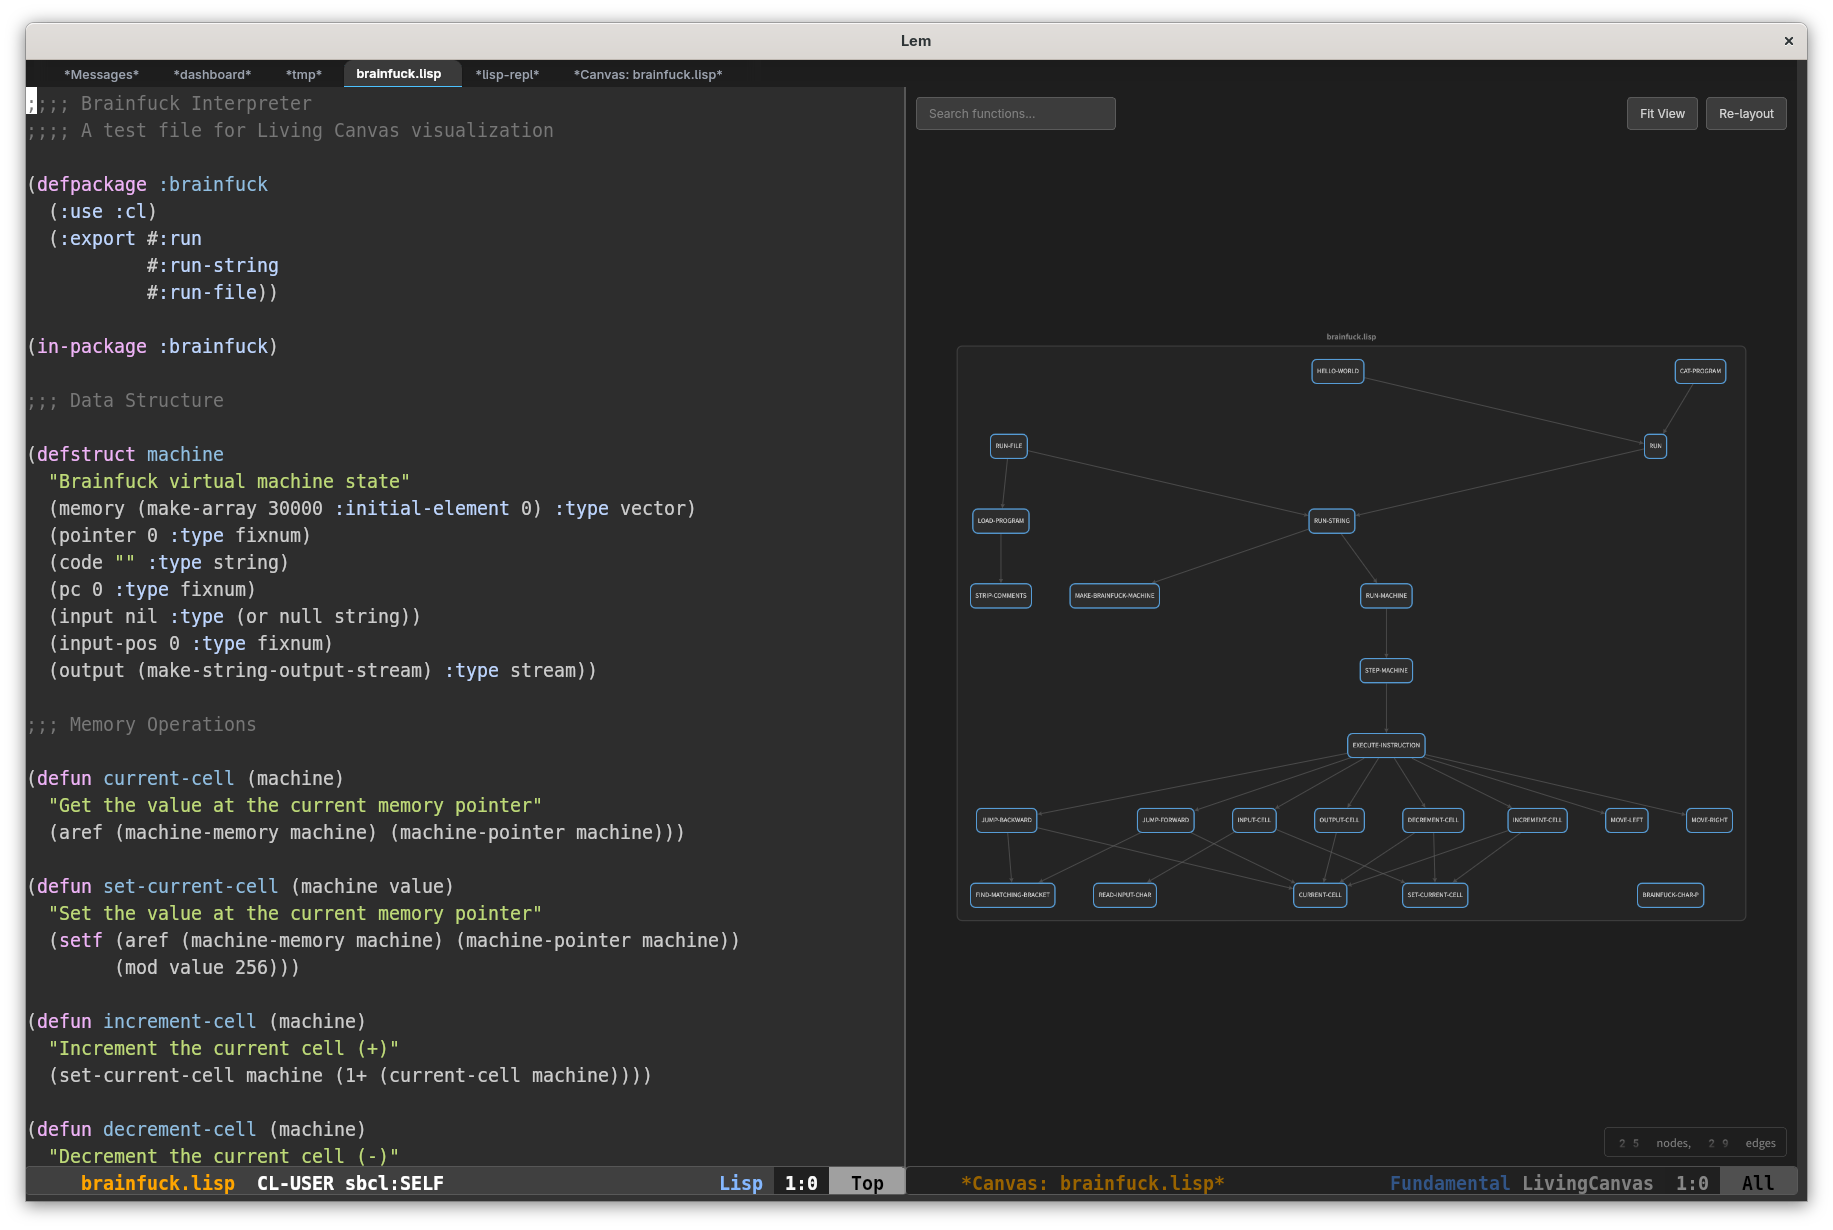
Living Canvas is a visual code analysis feature that displays function call graphs as an interactive, Figma-like canvas. It helps developers understand code structure, relationships, and execution flow.

| Language | File Extensions | Provider |
|---|---|---|
| Common Lisp | .lisp, .cl, .asd | micros (built-in) |
| Python | .py, .pyw | tree-sitter |
| JavaScript | .js, .mjs, .cjs, .jsx | tree-sitter |
| TypeScript | .ts, .tsx, .mts, .cts | tree-sitter |
| Go | .go | tree-sitter |
In Common Lisp, the Living Canvas is integrated with micros RPC system (Lem’s fork of Slime) to enable call graph visualization from connected runtimes.
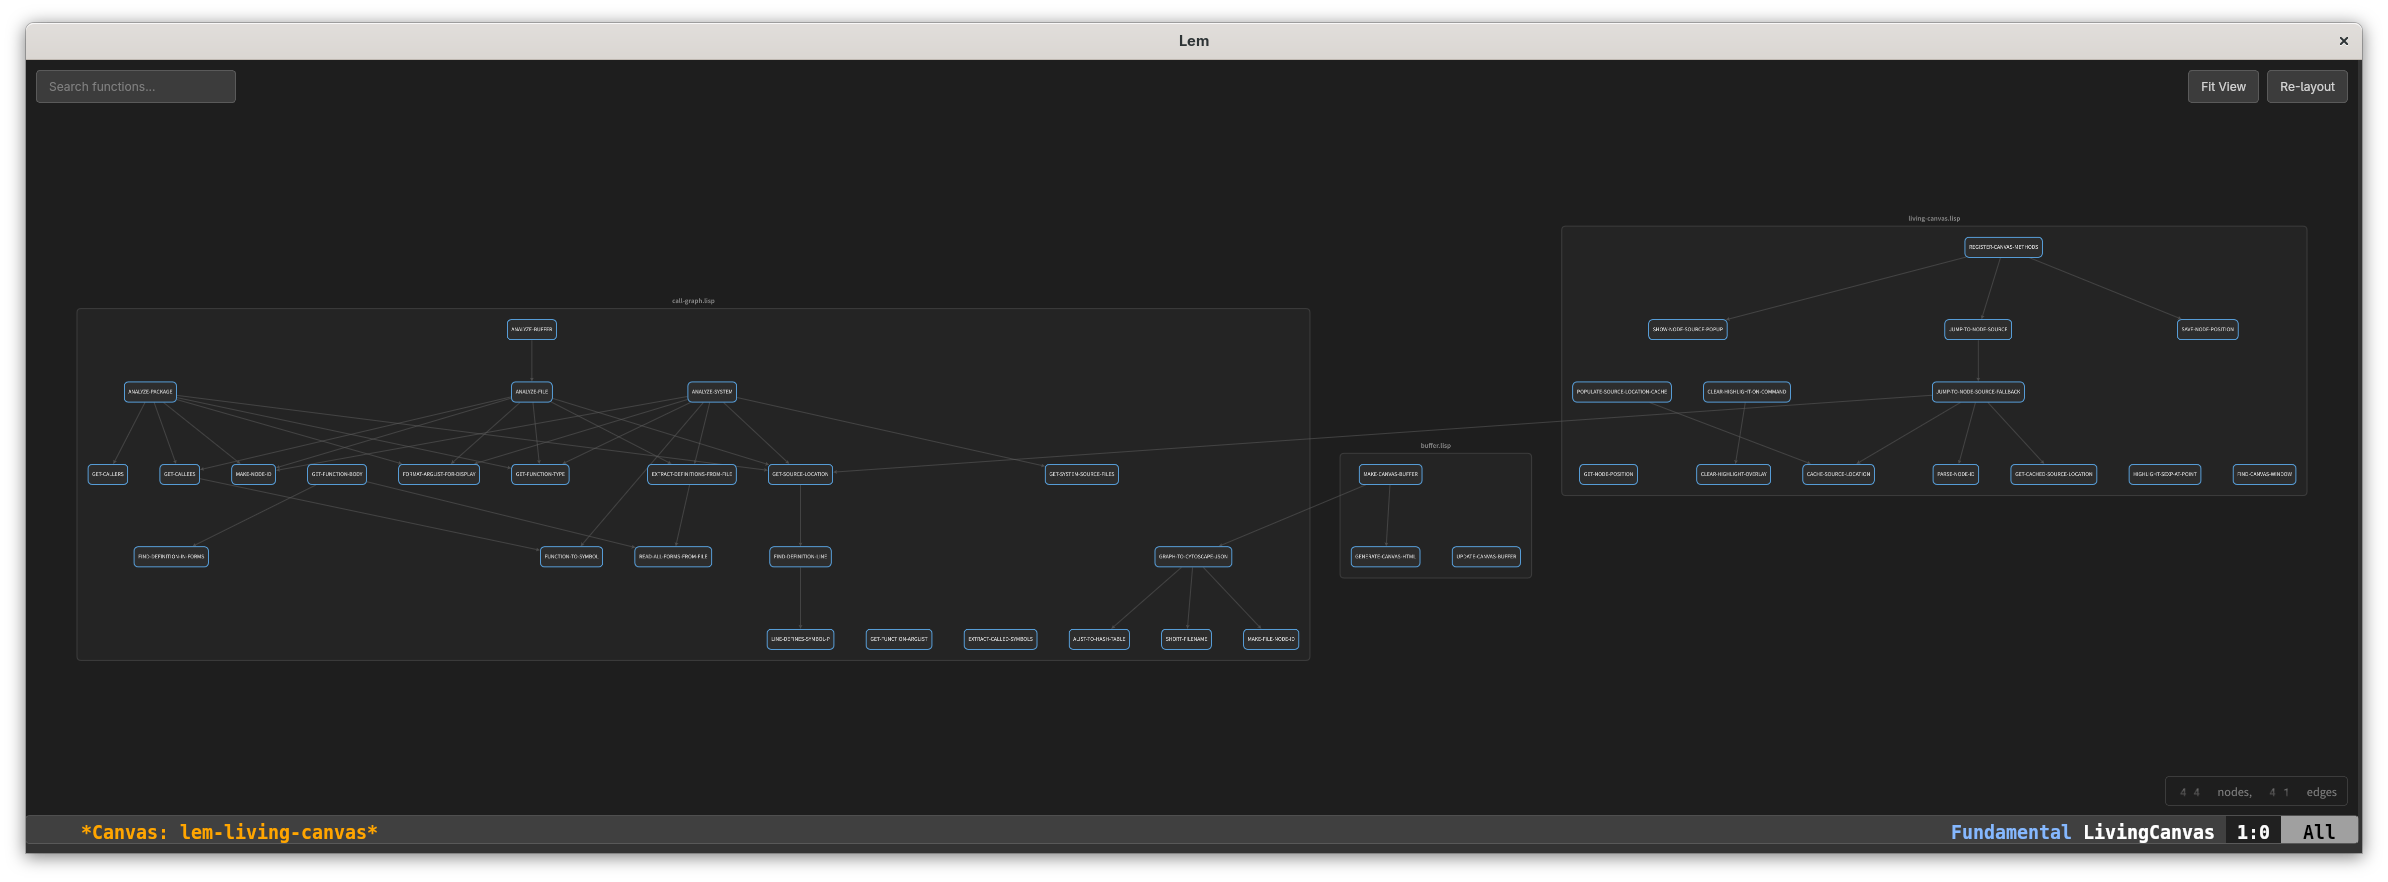
Living Canvas transforms source code into a navigable graph where:
- Nodes represent functions, macros, and generic functions
- Edges represent function calls between them
- Colors distinguish different types (function, macro, generic-function)
This visualization helps with:
- Onboarding to new codebases
- Understanding function relationships
- Code review and impact analysis
- Finding circular dependencies

Use Alt-x living-canvas and enter a package name:
Alt-x living-canvas
Package name: lem-core
This displays all functions in the package and their call relationships.
Use Alt-x living-canvas-current-file to visualize functions in the current buffer:
Alt-x living-canvas-current-file
Use Alt-x living-canvas-system to visualize an entire ASDF system:
Alt-x living-canvas-system
System name: lem
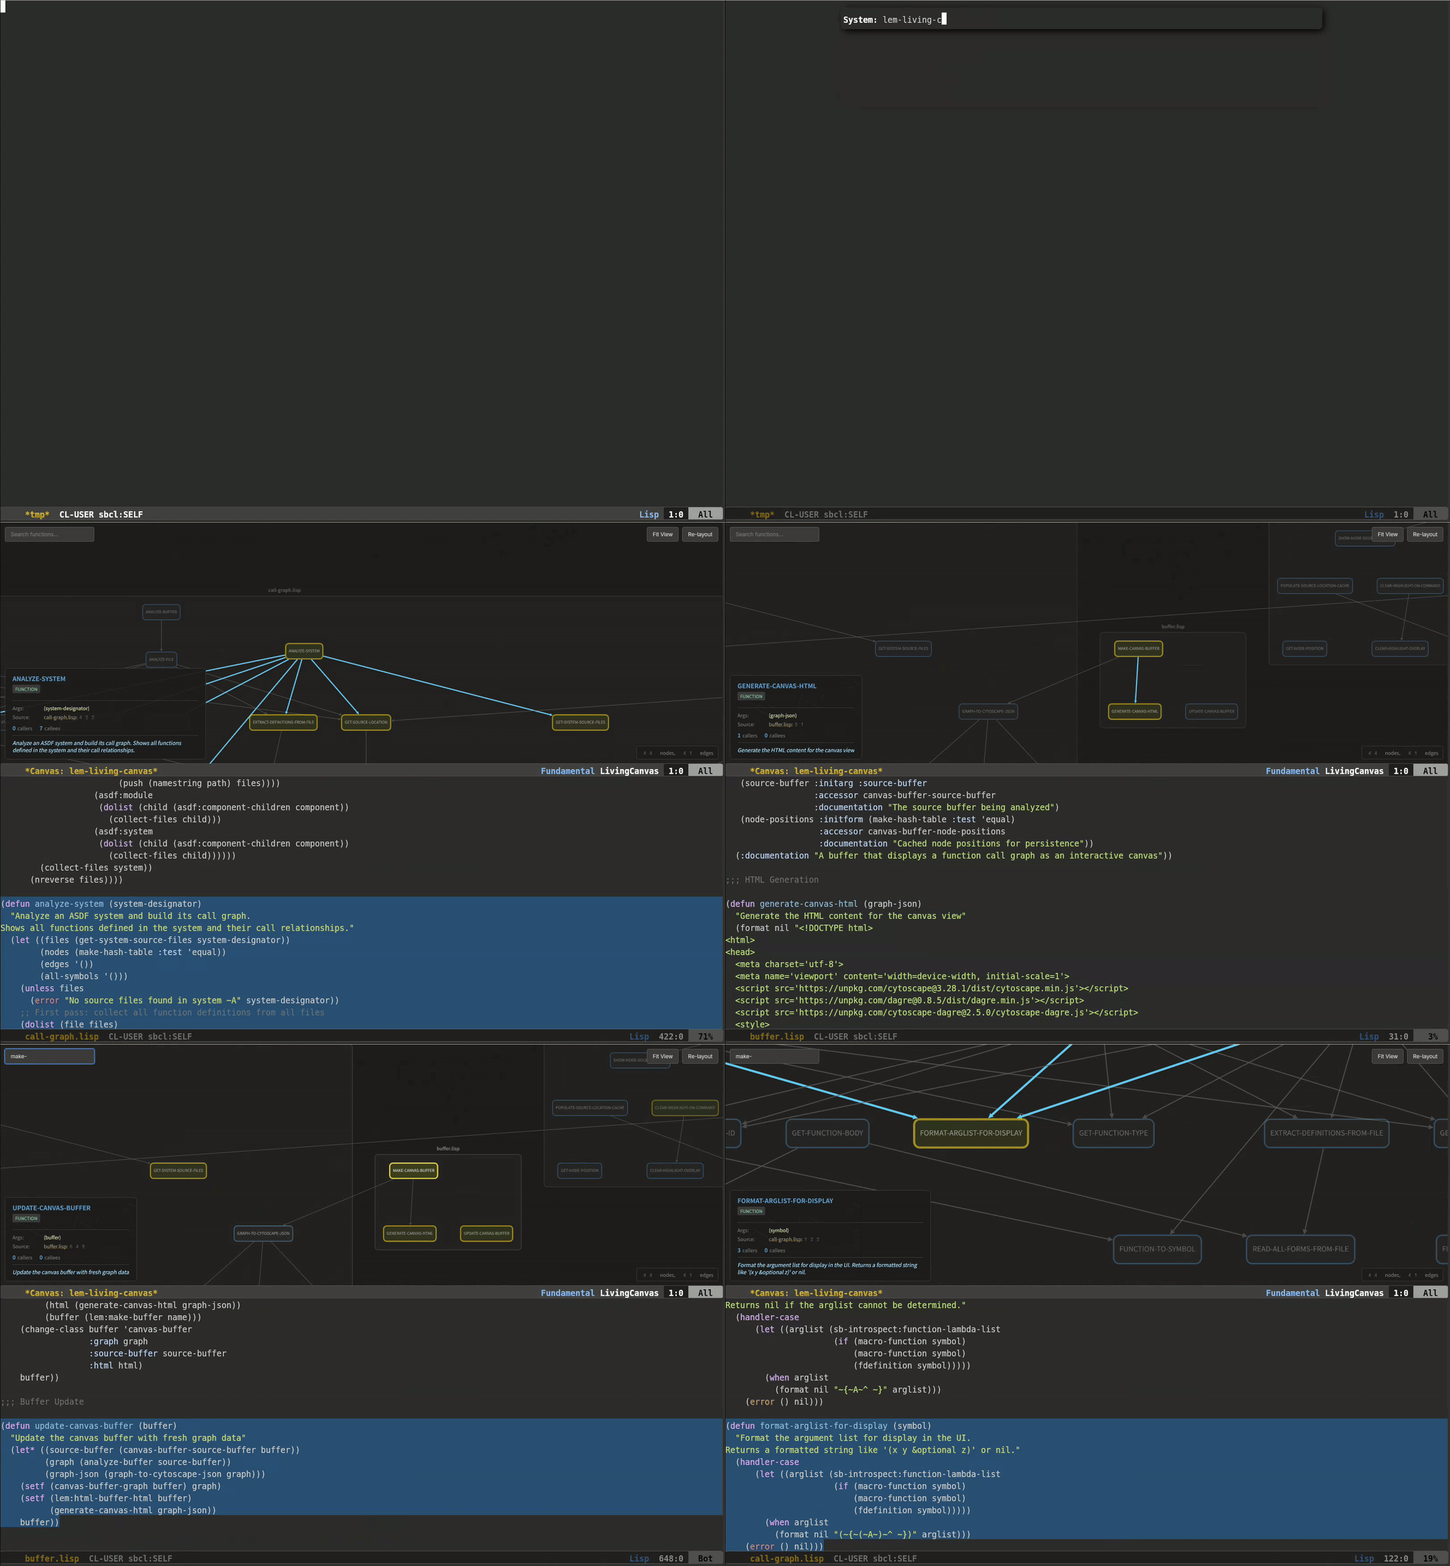
Single-click on a node to see detailed information in the info panel:
- Function name and argument list
- Source file and line number
- Documentation string
- Number of callers and callees
Double-click on a node to jump to its source code. The function definition will be highlighted in a split window.

Drag nodes to rearrange the layout. Node positions are preserved for the session.
Use the search box to find functions by name. Matching nodes are highlighted while others are dimmed.
When the canvas buffer is active:
| Key | Command | Description |
|---|---|---|
g | Refresh | Reload the graph |
q | Close | Close the canvas buffer |
t | Toggle Trace | Toggle execution tracing (Phase 2) |
s | Statistics | Show execution statistics (Phase 2) |
When joining a project, use living-canvas-system to get a visual overview of the codebase structure. Explore entry points and understand how components interact.
Before reviewing changes, visualize the affected package to understand the impact scope. Identify which functions depend on the changed code.
Visualize the relevant module and trace the call path from the entry point to the problematic function. This helps identify where data transformations occur.
Use the graph to identify:
- Highly connected functions (potential bottlenecks)
- Circular dependencies that need breaking
- Functions that could be extracted to separate modules
Living Canvas uses the lem-living-canvas package. You can customize keybindings:
(define-key lem-living-canvas:*living-canvas-mode-keymap*
            "r" 'lem-living-canvas:living-canvas-refresh)
- use the Language Server Protocol to make it usable with other languages
- Project-wide analysis for tree-sitter languages (currently single-file only)